

YouTube Studio Analytics: The Creator’s Guide to Every Metric That Actually Matters (2026)
YouTube Studio Analytics is the closest thing you have to a control room for your channel. The problem is that most creators walk into that control room, glance at the wrong dials, and walk out thinking they understand what’s happening.
What is YouTube Studio Analytics? YouTube Studio Analytics is YouTube’s free built-in dashboard for tracking channel and video performance. The five tabs, Overview, Content, Audience, Revenue, and Research, contain 80+ metrics, but only about 10 drive real growth decisions. The most important are Click-Through Rate, Audience Retention, Watch Time, Traffic Sources, and Average View Duration.
What Is YouTube Studio Analytics (and Why Most Creators Look at the Wrong Numbers)
YouTube Studio Analytics is the built-in performance dashboard for every YouTube channel. It sits inside YouTube Studio at studio.youtube.com, and it tracks everything from how many people saw your thumbnail this morning to which country watches you most on Sunday evenings.
Here is the uncomfortable truth: the dashboard shows more than 80 metrics, and only about 10 of them will change your decisions. The rest are context, vanity, or already implied by better numbers.
If you are checking likes and comments before checking Click-Through Rate and Audience Retention, you are reading the scoreboard instead of the playbook. This guide walks through the metrics that actually move channels, the ones you can ignore, and a hidden feature most creators never open.
How to Open YouTube Studio Analytics
On desktop, go to studio.youtube.com and click Analytics in the left menu. That opens the channel-level view, with the Overview tab loaded by default and a date range picker in the top right.
On mobile, open the YouTube Studio app and tap the Analytics icon in the bottom navigation bar. The mobile view has fewer options but shows all the key numbers, so it is fine for a quick check on the go.
To see analytics for a single video, go to Content, click any video, then click the Analytics tab. Video-level analytics show you exactly what happened for that upload, including the retention curve, traffic sources, top search terms that led people to it, and top external referrers.
One timing note that matters more than most creators realize: analytics for the last 48 to 72 hours may be incomplete. Some metrics update within a day, others take up to three. Revenue and audience demographics tend to be the slowest to finalize. If you upload on Friday and pull data on Saturday, you are looking at a rough draft, not the final numbers. Wait before you make decisions on a brand new upload. That single habit will save you from changing your entire strategy based on a data set that was never complete to begin with. YouTube has a good official Analytics guide if you want to reference their documentation directly.
The 5 Analytics Tabs, and What Each One Is For
Overview Tab, the 28-Day Snapshot
The Overview tab is the front page. It shows views, watch time, subscribers, and estimated revenue for the last 28 days by default, with a real-time card in the corner covering the last 48 hours.
Use Overview for a quick daily health check. Are views trending up, down, or flat? Is the real-time counter above or below your normal baseline? That is roughly all Overview should tell you. Do not build strategy from it.
Content Tab, Your Reach and Discovery Data
The Content tab is where the interesting numbers live. Impressions, Click-Through Rate, top-performing videos, and the full traffic sources breakdown all sit here.
This is the tab you open when you want to understand HOW people are finding your videos. Traffic sources in particular deserve its own section later in this guide, because that single chart tells you whether your descriptions are earning search traffic or not.
Audience Tab, Who Is Watching and Why They Stay
The Audience tab breaks down returning viewers versus new viewers, when your audience is on YouTube during the week, and top geographies, ages, and gender splits.
The most underused report in the entire YouTube Studio interface lives here: Videos growing your audience. It shows which videos in the last 90 days brought new viewers into your channel, not just views. If one video is quietly recruiting subscribers while another gets more views but no new followers, this report is the only place you will notice.
Revenue Tab, for Monetized Channels Only
If you are in the YouTube Partner Program, this tab shows RPM, CPM, monetized playbacks, and ad impressions. RPM (Revenue Per Mille) is what you actually earn per 1,000 views after YouTube’s cut. CPM (Cost Per Mille) is what advertisers pay before the split. Do not confuse them. RPM is the number that matches your bank deposit.
Also worth noting: your highest-earning videos are often not your most-viewed videos. Long, mid-roll-eligible content in high-CPM niches (finance, tech, B2B) can out-earn a viral Short by an order of magnitude.
Research Tab, the Insight Most Creators Never Check
Most YouTube analytics guides skip the Research tab or bury it in a footnote. That is a mistake, and it is one of the reasons this guide exists.
The Research tab shows what your existing audience is searching for on YouTube. Not what the general public searches for, but what people who already watch your channel type into the search bar when they are looking for something new. That is a much smaller, much more valuable data set than any generic keyword tool can give you, because it is filtered to viewers who have already demonstrated interest in your niche.
Three reports matter here:
- Your audience searches: topics people who watch your channel are actively looking for on YouTube right now.
- Content gaps: YouTube highlights topics with search interest but few results on your channel, meaning demand exists and you have not addressed it yet.
- Searches across YouTube: broader search trends in your topic area, useful for spotting rising interest before it peaks.
This is free keyword research pulled from your most engaged viewers. If you are not opening the Research tab at least once a month, you are ignoring the best content idea generator YouTube has ever built. A single 10-minute visit to the Research tab can seed three or four upcoming videos with topics you know your audience already wants. For a deeper walkthrough on turning that data into ranking videos, see our guide on YouTube keyword research.
The 10 YouTube Studio Analytics Metrics That Actually Drive Growth
Before we go metric by metric, here is the comparison table. Bookmark it, screenshot it, put it on the wall. These are the numbers that actually change decisions.
| Metric | What it measures | What good looks like | What to do when it is low |
|---|---|---|---|
| Click-Through Rate (CTR) | % of impressions that became clicks | 2 to 10% (audience-size dependent) | Test new thumbnail, rewrite title |
| Impressions | Times your thumbnail was shown | Rising over time on new uploads | Improve titles, thumbnails, consistency |
| Audience Retention Curve | % still watching at each moment | Gentle downward slope, few cliffs | Rebuild the hook, tighten the pacing |
| Average View Duration / APV | Time and % of video watched on average | Above 40% APV for long-form | Cut fluff, restructure middle |
| Watch Time | Total hours watched | Steady growth month over month | Publish more, longer, or both |
| Traffic Sources | Where views come from | Healthy mix of Search, Browse, Suggested | Diagnose which channel is weakest |
| Subscribers Gained per Video | New subs a single video drove | Positive on most uploads | Add stronger sub CTAs, review niche fit |
| Returning Viewer Rate | % of views from repeat viewers | Growing alongside new viewers | Build a series or content pillar |
| Audience Demographics | Age, gender, geography of viewers | Matches your intended audience | Adjust framing, examples, references |
| End Screen / Card CTR | % clicking end screens or cards | Above 1% on end screens | Move CTAs earlier, redesign the card |
1. Impressions Click-Through Rate (CTR)
CTR is the percentage of times your thumbnail was shown that resulted in a click. It is the single best signal of whether your title and thumbnail combination is doing its job.
Typical range is 2 to 10%. Larger channels often sit lower because YouTube shows their thumbnails to more marginal viewers, so context matters. A 4% CTR on 500,000 impressions is not the same channel-health story as 4% on 5,000 impressions.
Never look at CTR without impressions next to it. A video with 15% CTR on 200 impressions is a rounding error, not a win. If your CTR is stubbornly low, that is a title and thumbnail problem. Start with our guides on YouTube title optimization and YouTube thumbnail size.
2. Impressions
Impressions count how many times YouTube showed your thumbnail anywhere on the platform: home feed, suggested column, search results, subscriptions inbox, everywhere.
Low impressions mean the algorithm is not distributing your video widely yet. That is not always a failure. New uploads often start slow, then ramp as YouTube tests them with small audiences. Do not panic in the first 24 hours. Distribution builds.
If impressions stay low three days in, though, the algorithm is telling you it does not know who this video is for. Titles, thumbnails, and description keywords all shape that.
3. Audience Retention Curve
The retention curve is the graph showing what percentage of viewers are still watching at each moment of the video. It is the most important metric you cannot summarize with a single number, which is why it deserves the most attention when you audit a specific video.
The shape tells you the story, and each shape suggests a different fix:
- Steep drop in the first 30 seconds: your intro is not hooking viewers. Cut it, or rewrite it. This is the single most common retention problem on YouTube, and fixing your first 15 seconds usually delivers the biggest gains on future uploads.
- Flat middle section: content is doing its job. Viewers are staying engaged through the substance. Whatever you did in the middle of that video, repeat the structure.
- Sharp cliff near the end: video may be too long, or you cued the outro before delivering the payoff. Move your outro card later, or trim the ending.
- Small spikes upward: viewers rewound to catch something. That is a positive signal, and it usually points to a moment worth expanding on in future videos.
- Multiple small drops throughout: pacing issue. Sections are running too long, or transitions are unclear.
If more than 25% of viewers drop in the first 30 seconds, you have a hook problem. That is where to focus edits on future videos, not on adding more B-roll to the middle. The middle is not usually where you are losing people. The opening is.
4. Average View Duration (AVD) and Average Percentage Viewed (APV)
AVD is the average time viewers spend per view, in minutes and seconds. APV is the same idea expressed as a percentage of the video length.
Use APV when you are comparing videos of different lengths, because a 4-minute AVD is fantastic on a 5-minute video and mediocre on a 20-minute one. Benchmark against your own last 10 uploads of similar length, not against a generic platform average. Your niche and your format define what “good” means.
5. Watch Time (Total Hours)
Watch Time is cumulative hours watched. YouTube uses total watch hours as one of the eligibility gates for the YouTube Partner Program (4,000 public watch hours in the last 12 months for long-form).
Care about Watch Time when you are approaching monetization thresholds. Stop treating it as your primary metric after that, because a single long video can inflate it without representing actual channel growth. Ten viewers watching a two-hour livestream is 20 watch hours, but it is not the same growth signal as 200 viewers watching a 10-minute video.
6. Traffic Sources, the SEO Scorecard for Your Descriptions
Traffic Sources shows where your views came from, broken into buckets: YouTube Search, Browse Features, Suggested Videos, External, and Direct or Other. This is the single most useful chart in all of YouTube Studio, and it doubles as a scorecard for your description and keyword work. If you only checked one report per week, this would be the one.
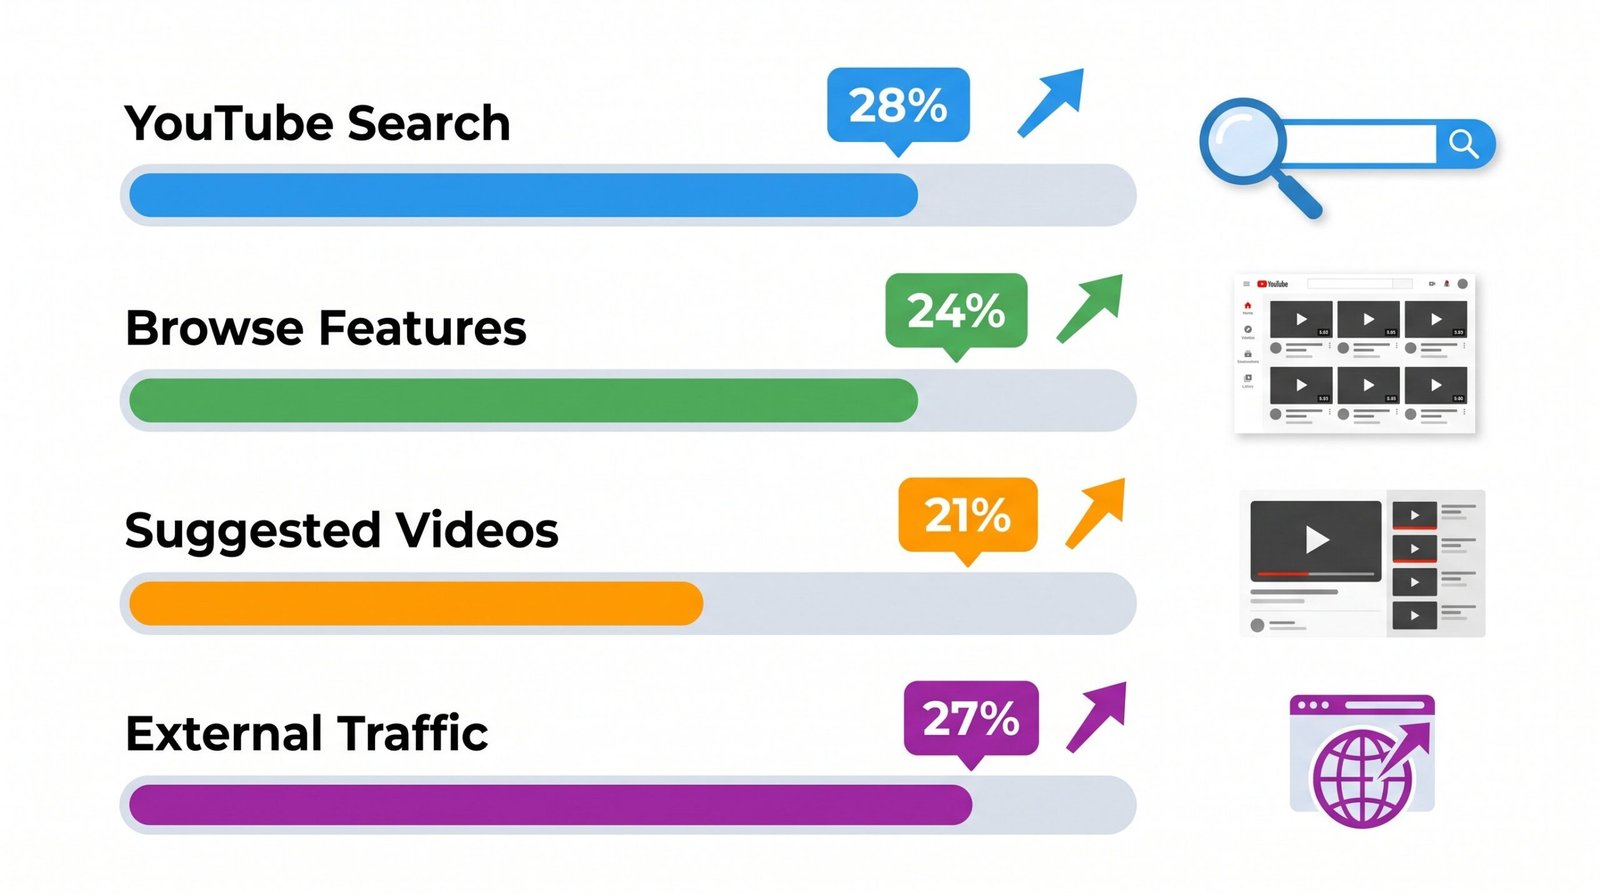
Here is how to read each source:
- YouTube Search: if the share is growing, your descriptions, titles, and tags are ranking. If it stays flat despite content you know is good, your descriptions likely need keyword work. See our guide on how to write a YouTube description for the specific format that pulls Search traffic. On informational content, healthy channels often see 20 to 40% of views coming from Search.
- Browse Features: YouTube’s algorithm is actively pushing your video to the home feed. That is a strong growth signal. Videos with high Browse share tend to have strong thumbnails and consistent viewer patterns that the algorithm has learned to trust.
- Suggested Videos: your video is appearing next to related content, often from other creators in your niche. High Suggested share means the algorithm sees your content as a good match for whatever viewers just watched, which is one of the fastest ways to grow a new channel.
- External: traffic from outside YouTube. Blog embeds, Reddit posts, newsletter links. Nice to have, rarely a growth engine on its own, but worth watching if you actively promote your videos elsewhere.
- Direct or Other: notifications, playlists, and shares. Usually the smallest slice, but a healthy Direct number suggests your subscribers are actually clicking notifications when you upload.
If YouTube Search is under 15% of total views on informational content, review your descriptions and titles. If Browse dominates but Search is nowhere, you have a discovery-driven channel that is not yet ranking for searches, and that is worth fixing because search traffic compounds over time in a way home-feed traffic does not. Search traffic keeps arriving months and years after upload. Browse traffic dries up when the algorithm moves on to newer videos.
7. Subscribers Gained per Video (Not Total Count)
Total subscriber count is a lagging vanity number. Subscribers gained per video tells you which content is actually recruiting new followers.
Combine this with the “Videos growing your audience” report in the Audience tab. Between them, you will find your channel’s top three or four recruiter videos, and the pattern almost always suggests what to make next.
8. Returning Viewer Rate
Returning viewer rate is the percentage of views coming from viewers who have watched your channel before. High returning viewer rate signals a loyal community. Low returning viewer rate means your growth is almost entirely discovery-driven, which is fine short term but fragile long term.
The healthiest channels see both returning and new viewer counts growing at the same time. If one number climbs while the other drops, something in your programming has shifted.
9. Audience Demographics (Age, Gender, Geography)
Demographics tell you who is actually watching, which is often not who you thought you were making videos for.
Use this to adjust framing, references, and examples. If your channel is skewing 40% India but your examples are all US-centric, you have a mismatch worth addressing. Subtitles and translations can also open international audiences at almost zero content cost.
10. End Screen and Card Click-Through Rate
End screens and cards are the CTAs that appear at the end and during your videos. Their CTR is often overlooked, but if your end screens are pulling 0.5% or below, they are almost certainly not placed well or not clear enough about what viewers get by clicking.
Action: on longer videos, move your end screen CTA slightly earlier so it appears while viewers are still engaged, not after most of them have already left. And keep the CTA to two options maximum. Three or more splits attention and reduces click share on each.
How Your Video Description Affects Your Analytics
Most guides treat descriptions as an afterthought. That is a mistake, because YouTube Analytics tells you very precisely whether your descriptions are working. It just tells you indirectly.
The signal is the YouTube Search slice of your Traffic Sources report. That number is the closest thing you have to a description SEO scorecard. Here is the four-step audit.
Step 1: Go to Content tab, then Traffic sources. Note the percentage of views coming from YouTube Search.
Step 2: Compare that percentage across your last 10 videos. Do the ones with longer, keyword-rich descriptions pull more Search traffic than the ones with a single-sentence description? If yes, that is your description formula working. If no, your descriptions are probably not doing the work.
Step 3: If a video has strong impressions from Browse but almost zero from Search, the description is likely missing keyword depth. Add the focus keyword to the first two lines, then repeat variations in the body.
Step 4: Open the Research tab. Find topics your audience already searches for on YouTube. Then go back and update descriptions on older videos to target those terms. This is the highest-leverage optimization you can do, because you are matching real search intent to existing content.
| Analytics signal | What it means for your descriptions | What to change |
|---|---|---|
| High Browse / Low Search | Description not keyword-optimized | Add focus keyword to first 2 lines |
| High Search / Rising CTR | Description and title aligned with search intent | Keep the formula, replicate it |
| High impressions / Low CTR | Title or thumbnail mismatch with description promise | Revisit the hook, match thumbnail to promise |
| Low impressions overall | Too niche or too new | Wait 72 hours, consider a broader title |
| Search share falling over time | Competitors ranking above you | Refresh description with current search terms |
YouTube itself has publicly identified the four metrics YouTube identifies as most important for growth, and Traffic Sources is on that list precisely because it is the diagnostic that reveals where the algorithm is currently placing you.
7 YouTube Analytics Metrics You Can Stop Obsessing Over
YouTube Studio shows too many numbers. Here are the seven that most creators check too often and adjust too much strategy around.
- Total view count. A pure vanity metric. It does not tell you who watched, why they clicked, or whether they stayed. Impressions plus CTR plus retention tells the same story with actionable detail.
- Likes and dislikes ratio. Engagement signal, yes, but retention and CTR are cleaner proxies for what the algorithm cares about.
- Comment count. Great for community pulse. Terrible for algorithm signals. Do not chase comments in place of watch time.
- Shares. Useful at scale for large channels. Noisy and misleading for smaller ones, where a single power user can distort the number.
- Real-time views after 48 hours. Only useful for the first two days of a new upload. After that, the real-time card is entertainment, not information.
- Card click-through rate. Worth optimizing later. Not worth adjusting your channel strategy around early on.
- Unique viewers versus total views. Interesting for understanding repeat watches, usually noise for growth decisions.
The 15-Minute Weekly YouTube Studio Analytics Audit
You do not need to check analytics daily. You need to check them consistently, on a schedule, without letting the dashboard become an anxiety loop. Here is a repeatable 15-minute weekly ritual.
Step 1 (5 minutes): Overview tab, last 7 days. Compare views, watch time, and subscribers against the prior 7 days. Is the trend improving, flat, or declining? Write down one sentence describing what you see.
Step 2 (5 minutes): Content tab, last 3 videos. For each one, note CTR, AVD or APV, and the top traffic source. Which performed above your channel average? Which underperformed, and by how much?
Step 3 (5 minutes): Research tab. Note the top three audience searches. Add any topics you have not made videos about to your content backlog for future planning.
One timing note: do this audit on a Wednesday or Thursday. Monday data for weekend uploads is still stabilizing, and you will misread numbers that have not fully landed yet.
Ask Studio, YouTube’s AI Analytics Assistant (2026)
Ask Studio is a conversational AI feature YouTube launched in 2025 inside YouTube Studio. It lets you ask questions in plain English and get answers pulled from your own channel data.
Examples of questions it handles well:
- “Which of my videos had the highest CTR last month?”
- “What is my average view duration for Shorts versus long-form?”
- “Which audience segment watches the most of my videos?”
- “Which day of the week has the highest view count on new uploads?”
You will find it inside YouTube Studio, in the Analytics area, as an “Ask Studio” button at the top right of the dashboard. Type a question, get an answer plus a small chart or table.
One important caveat: Ask Studio only answers from your own channel data. It does not compare you to industry benchmarks, and it does not know what other creators in your niche are seeing. Use it for internal diagnostics, not competitive research. For competitive analysis, external tools do a better job. See our roundup of the best YouTube SEO tools for options like TubeBuddy and VidIQ that fill that gap.
Frequently Asked Questions
What is a good CTR on YouTube?
A healthy Click-Through Rate typically falls between 2 and 10 percent, though the exact number depends on your channel size and niche. Larger channels often see lower CTR because YouTube shows their thumbnails to broader, less-targeted audiences. Rather than chasing an absolute number, benchmark your CTR against your own last 10 uploads.
How long does it take for YouTube Analytics to update?
Most YouTube Analytics data updates within 48 hours, but some metrics can take up to 72 hours to finalize. Real-time views appear within seconds, watch time and subscriber counts usually stabilize within a day, and revenue-related metrics can take the longest. Wait at least three days before making strategy decisions on a new upload.
How do I see analytics for a specific video in YouTube Studio?
Open YouTube Studio at studio.youtube.com, click Content in the left menu, then click the video you want to analyze. Click the Analytics tab at the top of the video page. From there you can see the retention curve, traffic sources, top search terms, and every other metric for that specific upload.
What is the difference between impressions and views?
Impressions are the number of times your thumbnail was shown to a viewer anywhere on YouTube. Views count how many times someone actually clicked and watched. The ratio between them is your Click-Through Rate. A video can rack up thousands of impressions and only a handful of views if the thumbnail and title are not doing enough to earn the click.
What should I check first when I open YouTube Studio Analytics?
Start with the Content tab, not the Overview tab. Look at your last three videos and check three numbers for each: CTR, Average View Duration or APV, and the top traffic source. That three-metric snapshot tells you more about your channel’s current trajectory than any single number in the Overview tab.
How do I know if my video description is helping my YouTube search ranking?
Check the Traffic Sources report inside the Content tab. Look at the percentage of views coming from YouTube Search. If that share is growing over time or is higher on videos with keyword-rich descriptions, your descriptions are working. If Search share is flat or near zero, your descriptions likely need keyword optimization. The Research tab can help you find the right terms to add.
What is the difference between watch time and average view duration?
Watch time is the cumulative total hours all viewers spent watching your video or channel. Average view duration is the average time a single viewer spent watching one video. Watch time is a total, average view duration is a per-viewer average. Both matter, but they answer different questions.
Where to Focus Next
If you take one thing from this guide, make it this: YouTube Studio Analytics is a diagnostic tool, not a scoreboard. The goal is not to check it more often. The goal is to check the right numbers at the right cadence, and to change one thing at a time based on what you see.
Start with the weekly 15-minute audit. Add the Research tab to your monthly routine. And when you see YouTube Search traffic climbing on a specific video, go read that video’s description and title, because whatever you did there is worth repeating on the next upload. For the description formula specifically, our description writing guide walks through the exact structure that pulls Search traffic.